Forest stability: A marker of our oldest, strongest forests
This metric of ecosystem integrity helps quantify the characteristics of primary forests
Researchers walk into Howland Forest, a primary forest in Maine.
photo by Jonathan Kopeliovich
Associate Scientist, Dr. Brendan Rogers has walked in many forests, but primary forests, he says, “just feel different.”
Rogers’ work often takes him to the cool, dark understories of black spruce and pine boreal forests, where he’s learned the subtle markers of a truly old, healthy, stable forest ecosystem.
“Generally cooler, often wetter, the trees are bigger but sparser and more likely to be conifers than shrubs or deciduous broadleaf trees,” says Rogers. “The ground is squishy to walk on, from the build-up of peat-like soils, mosses, and lichens.”
Primary forests are also a critical piece in the climate puzzle. They represent centuries of sequestered carbon, and every year they remain standing these forests continue to pull carbon from the atmosphere and lock it away in their trees and soils. They are also the subject of intense debates in forest management circles because, according to Rogers, despite knowing intuitively when you are standing in a primary forest, quantitatively identifying one is a tricky task.
That fact hasn’t deterred Rogers and his collaborator Dr. Brendan Mackey at Griffith University, from their work to identify and map metrics indicative of primary forests. In a joint project launched in 2018, Rogers and Mackey created an index of one such metric—forest stability.
The floor of a boreal forest, carpeted in a thick layer of moss.
photo by Brendan Rogers
Measuring forest stability
Forest stability is a measure of a forest’s resistance to disturbances, both manmade and natural. A stable forest has a high level of ecosystem integrity—a holistic term referring to the combination of ecosystem structure, function, species composition, and adaptive capacity. Stability reflects the ability of a forest to maintain all of those elements in the face of disturbance.
To quantify stability, Rogers and Mackey isolated two metrics that correlate heavily with integrity in forests—“greenness” and water stress. Greenness, also known as the fraction of photosynthetically active radiation (fPAR), indicates the amount of thriving, photosynthesizing plants. Water stress is an index of anomalies in vegetation moisture, indicating an area is dryer than usual. Both of these metrics can be remotely derived from satellites and, when combined with additional data, form an index of overall stability level.
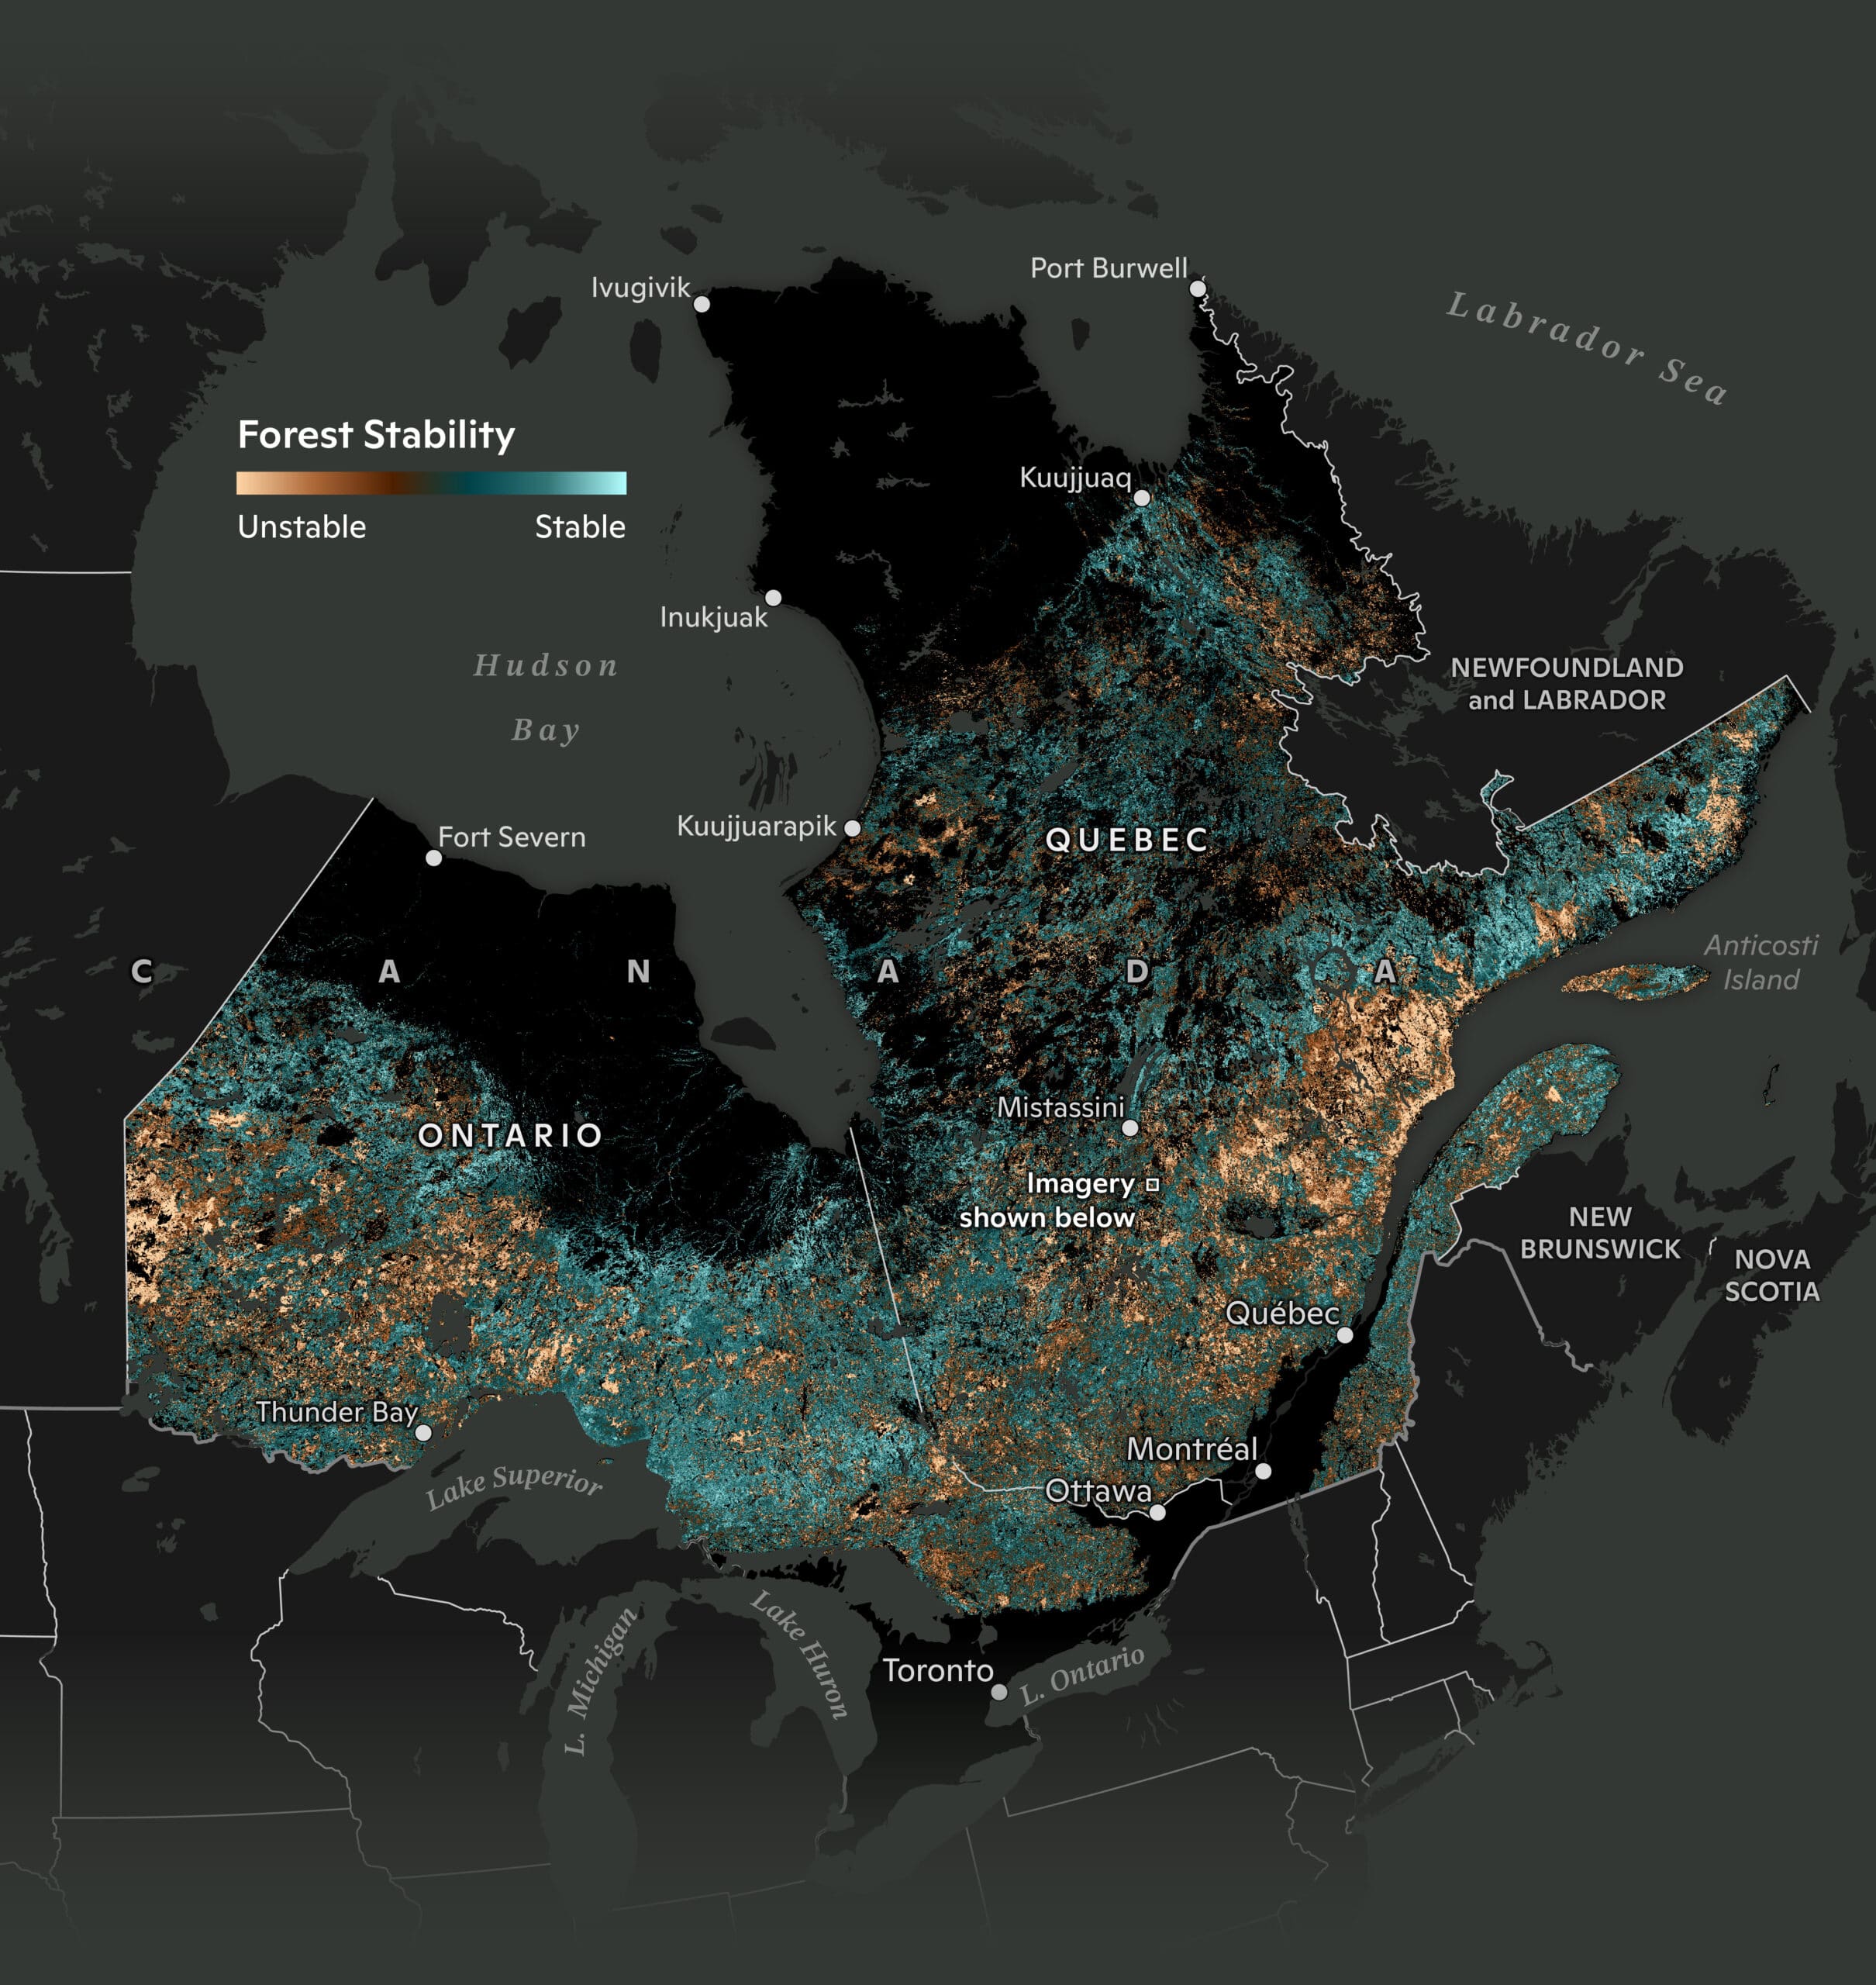
map by Christina Shintani
This index was first tested by a postdoctoral scientist at Woodwell Climate, Dr. Tatiana Shestakova, who pulled data from NASA’s MODIS satellite sensor to map stability in sample regions in the Kayapo Indigenous Territory in the Brazilian Amazon and southern Taiga region of Siberia. After testing the model, Rogers, Mackey, and Shestakova expanded it to map stability across the entirety of Ontario, Quebec, boreal Siberia, and the Amazon rainforest.
The studies used a method called a time series analysis, which compares satellite data stretching back to 2002 to determine whether a forest had experienced a large-scale disturbance, reducing vegetation greenness and increasing water stress and thus lowering overall stability. These insights were only possible due to the long, consistent dataset produced by MODIS.

Satellite imagery shows logging in a forested area of Quebec that the index identified as having low stability.
map by Christina Shintani
“It can be a little bit dicey to assess stability on shorter time scales,” says Rogers. “Because when you work with remote sensing data, forests can fluctuate year to year and sometimes you can’t completely eliminate things like cloud contamination or other errors from the data, so a longer time series helps smooth the data and lets you see the true patterns.”
Prioritizing protection for primary forests
These maps of stability have a crucial role to play in informing forest management policy.
“We’re trying to analyze and spatially map the ecological condition of forests,” says Mackey. “Because this information is needed to help guide where investments for forest protection and restoration go and how they should be prioritized.”
For a long time, Mackey says, management conversations did not distinguish between types of forests, lumping monoculture tree plantations into the same category as ancient natural forests, despite the vast differences in their carbon storage, biodiversity, ecosystem benefits, and overall resistance against disturbances.
“We weren’t seeing the forest for the wood,” Mackey jokes.

Planted forests, like this eucalyptus plantation in Brazil, tend to have lower stability compared to natural primary forests.
photo by Mitch Korolev
Quantifying a characteristic like stability makes it easier for managers to see the difference between the two, identify the forests best able to provide myriad ecological benefits, and ideally, prioritize those for protection.
Mackey uses the example of woodland caribou in Canada, which are considered a threatened species. These animals require large areas of intact primary forest to support successful populations. Overlaying forest stability on top of caribou habitat maps can help decision makers narrow in on the largest, highest-stability tracts of forest as top priority for conservation.
According to Rogers, a future goal would be to eventually link maps of forest stability with carbon estimates in order to create forest protection plans with climate mitigation in mind. Research in primary forests has shown they continue to sequester carbon year over year, even though tree growth has tapered off. With primary forests in many places under intense political and economic pressures, it will become even more important to demonstrate the many co-benefits of protecting the earth’s stable forests.
“There’s no forest anywhere that isn’t threatened,” says Mackey. “Development, infrastructure, roading, damming, logging, clearing for agriculture. It’s happening everywhere.”
Sometimes resistance is better even than being resilient. You’re not destroyed in the first place.Brendan Mackey
Stable forests are resilient forests
Tracking stability of forests also allows us to approach a much harder-to-define characteristic of primary forests—resilience.
Stability and resilience go hand in hand, though they are not the same thing. While resilience speaks to an ecosystem’s adaptive capacity or its ability to recover to its original state after some disturbance, stability is a measure of resistance, which is why it correlates so highly to primary forests that haven’t experienced any recent large-scale disturbance.
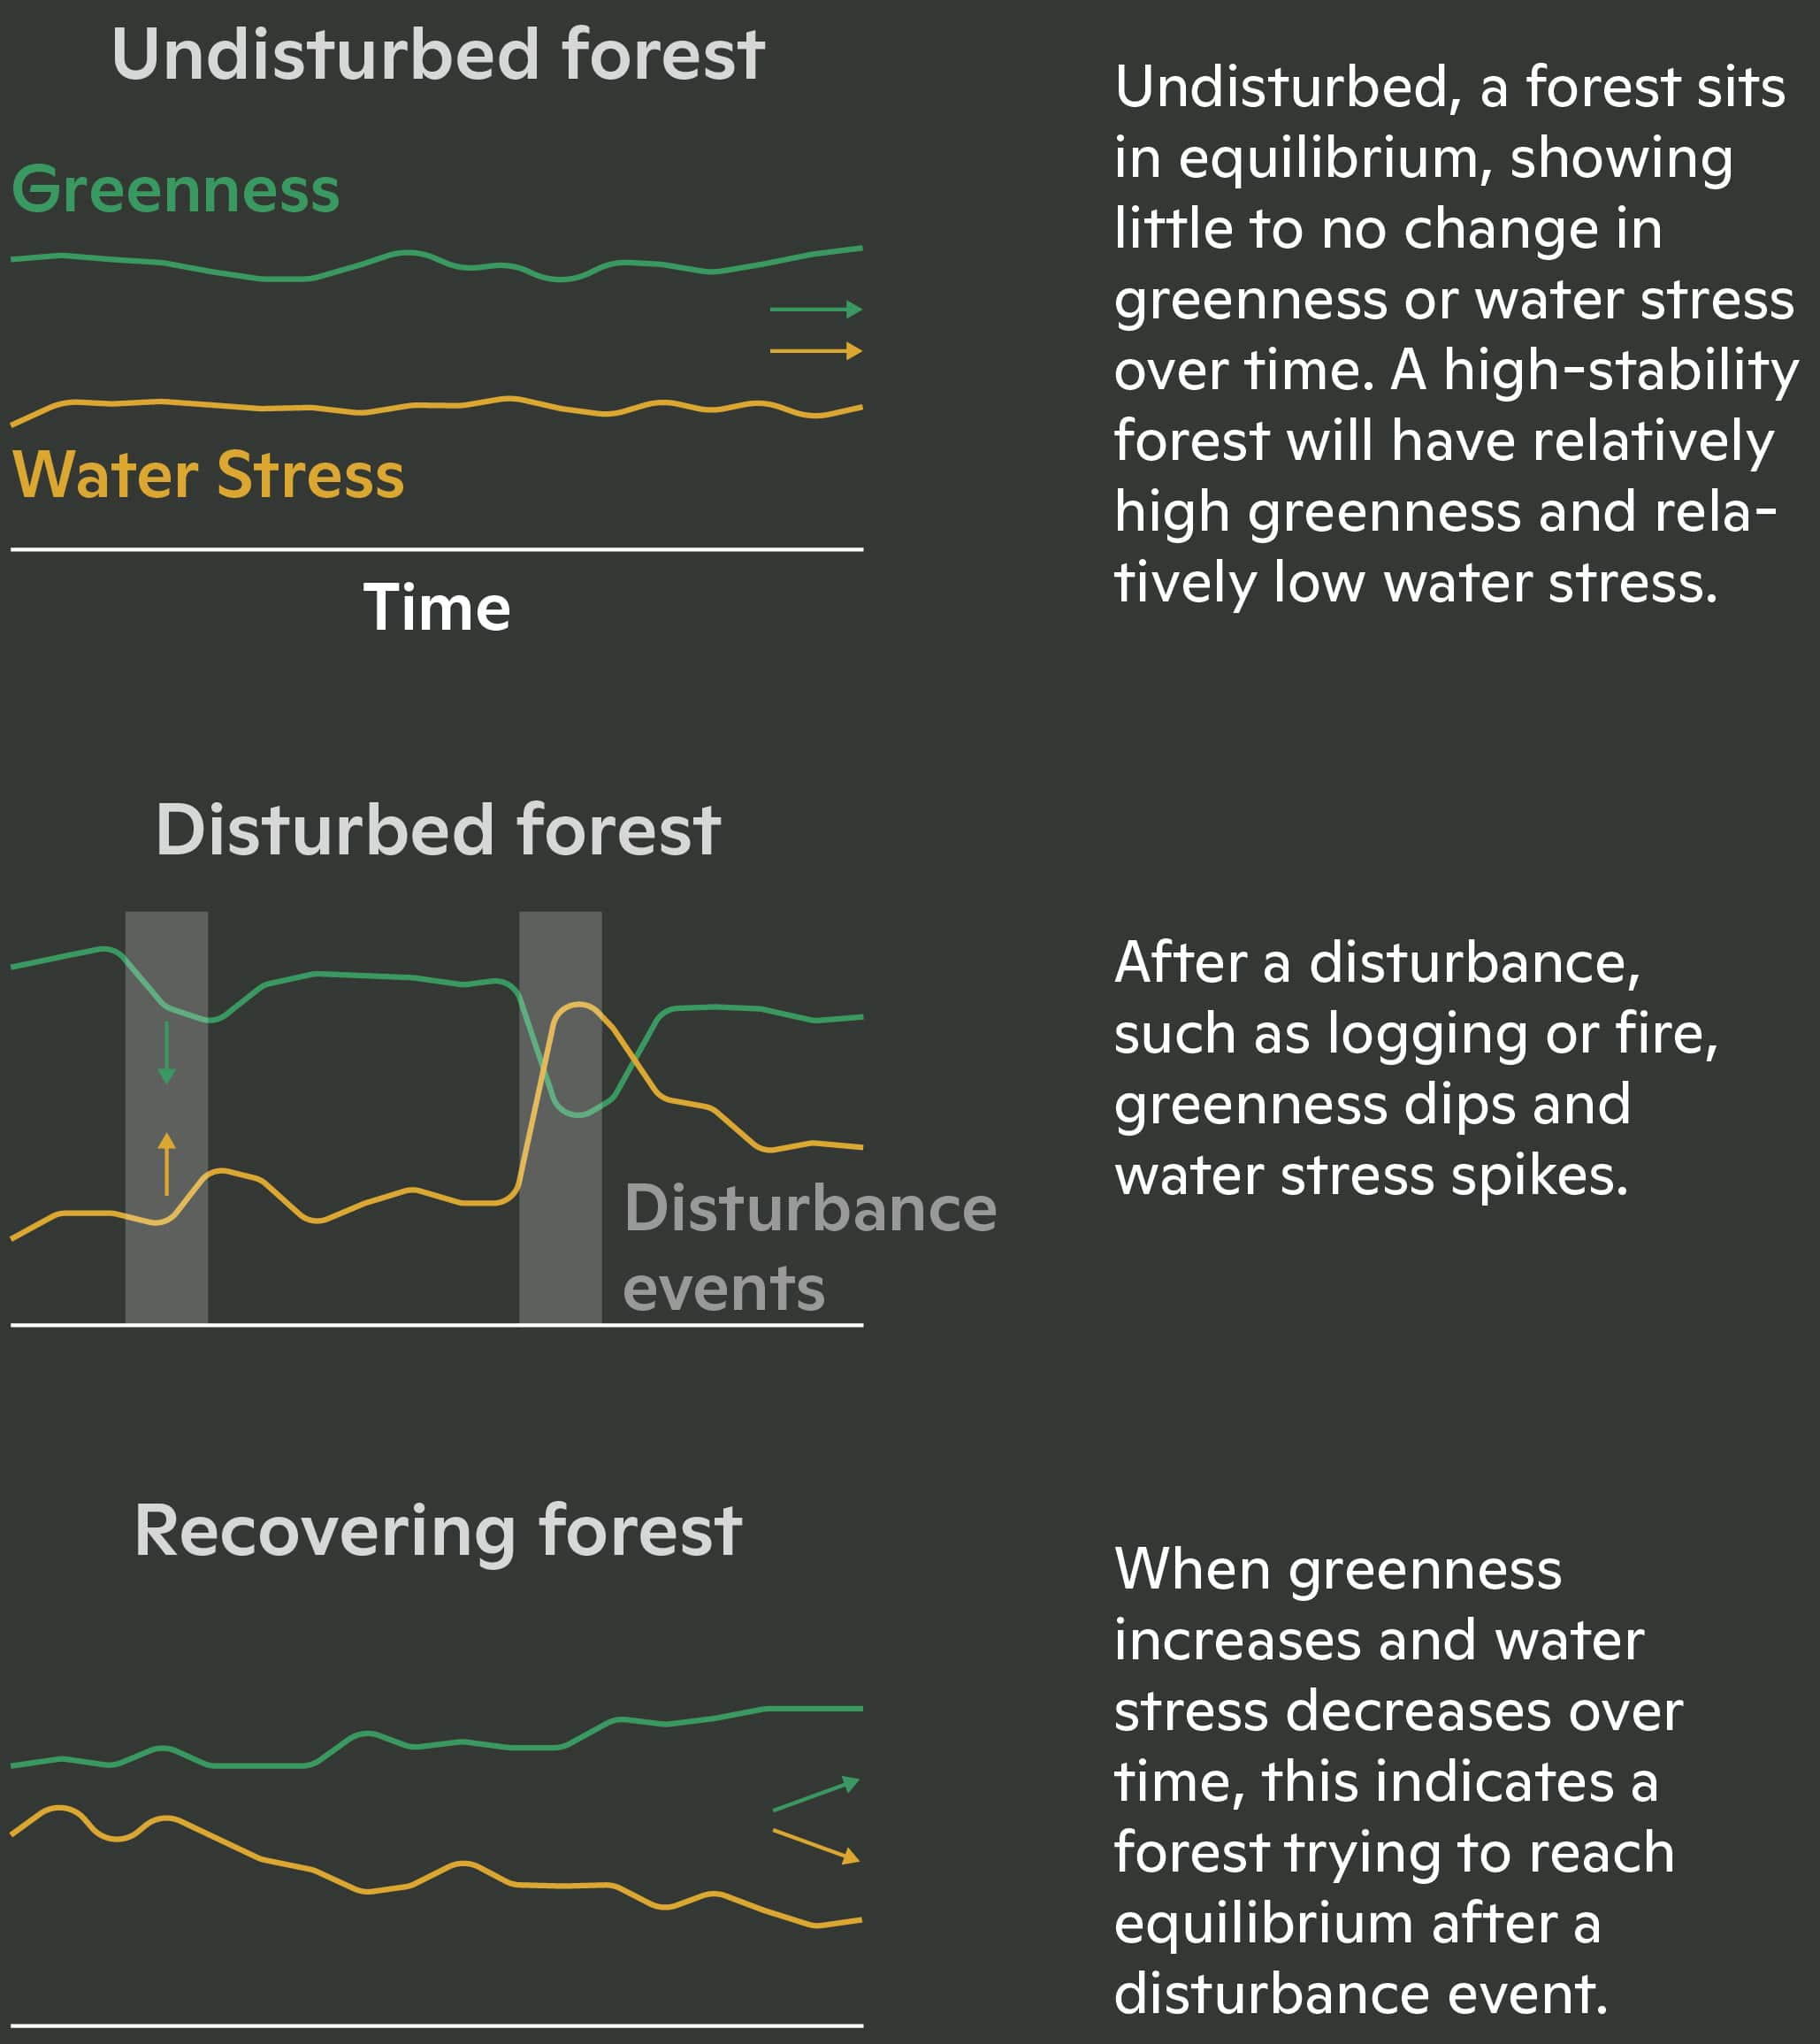
graphs by Christina Shintani
“If the stability index is showing recovery, then there’s obviously some resilience happening, but beyond that, primary forests tend to be more resistant to certain disturbances,” says Mackey. “Sometimes resistance is better even than being resilient. You’re not destroyed in the first place.”
Highly stable forests do tend to have better adaptive capacities as well, which is why they are so critical to protect.
“By and large,” says Rogers, “forests are resilient.” The stable ones can handle disruptions, and if you leave them to recover they will do just that, as he and Mackey have seen in the data.
But resilience is not infinite. If you hit too hard too fast—overlapping disturbances on an already unstable forest—you can overwhelm its resilience. Fires, larger and more frequent as a result of climate change, have already begun to override boreal forests’ adaptation. And there are more changes coming as the planet continues heating up.
For now, at least, Rogers says, “resilience is still largely what we see out there.”


