Chaotic March weather has a surprising secret
Seemingly unrelated weather systems illustrate how connected we are by larger patterns that move around in our atmosphere. Meanwhile, “weather whiplash” could be evidence of the warming climate.

As its final days wind down, weather in March 2026 has been one for the record books. It showed why old sayings endure and rivaled college basketball for “March Madness.”
True to the proverb, the month came “in like a lion,” and later echoed Shakespeare’s warning to “beware the ides of March.”
Relentless, record-breaking heat persisted in the West. Powerful storms and bouts of polar air blew through the Central and Eastern U.S., bringing extreme swings in temperature within hours. Hawaii endured flooding rains in a string of kona lows.
It may come as a surprise, but these weather systems also illustrate how connected we are by larger patterns that move around in our atmosphere.
Continue reading on USA Today.
In a new paper, published today in Science, climate scientists from Woodwell Climate Research Center and leading research institutions across the world propose the creation of a new, global methane observation system to track methane emissions from natural ecosystems in near real-time and inform mitigation strategies and global climate policy.
Methane’s powerful near-term warming effects–80 times that of carbon dioxide–position methane mitigation as an urgent and important target for actionable global climate policy. Over the past decade, scientists and policymakers have made important strides in tracking methane emissions from anthropogenic sources, including fossil fuels, livestock, agriculture, waste management, and integrating those emissions in international climate policy and mitigation strategies. However, escalating methane emissions stemming from natural ecosystems driven by global temperature increases and climate feedbacks, such as tropical wetlands and thawing permafrost, make up more than one-third of the global methane budget, and yet remain largely omitted from global methane budgets and decisionmaking due to gaps in monitoring.
“As the planet warms, methane emissions from these natural systems, including permafrost, lakes, and wetlands, are rising quickly, bringing the potential for increased frequency and impact of extreme weather events like flooding, drought, wildfire, and extreme heat. Our ability to track and detect these emissions will be critical to informing solutions to the climate crisis,” said Dr. Jennifer Watts, Scientist at Woodwell Climate Research Center and lead author of this paper. “We are calling on national governments, international institutions, philanthropies, the private sector, and other partners to invest in adequate infrastructure to detect and monitor temperature-driven methane emissions from ecosystems to guide solutions that curb the impacts of methane and the climate crisis.”
This paper grew out of a multi-day convening of more than 30 leading methane scientists, modelers, and policy experts held in Aspen, Colorado in October 2025, organized through the Aspen Global Change Institute (AGCI). Co-chaired by scientists from Woodwell Climate Research Center/Permafrost Pathways, Stanford University, Arizona State University, and Spark Climate Solutions, the workshop brought together participants from universities, federal agencies, and research institutions spanning six continents to identify critical gaps in natural methane monitoring and chart a course for an integrated global observation system. The findings and recommendations in this paper reflect the collective expertise of that broader scientific community.
As global leaders in methane science, policy, and innovation prepare to gather at Methane 250 in Italy next week to chart a path forward for methane mitigation, this paper makes the case for investing in the development of an integrated Global Ecosystem Methane-Observation System to inform future Global Methane Pledges and action. Specifically, this system would close gaps in methane monitoring by securing and expanding ground-based networks of greenhouse gas observing towers, including flux towers, across underrepresented regions including rapidly thawing Arctic permafrost and wetlands in the tropics.
“Through Permafrost Pathways, we’ve seen firsthand how critical it is to fill the monitoring gaps in the Arctic, where thawing permafrost releases methane across landscapes so vast and varied that our current observation systems cannot fully capture them,” said paper co-lead and workshop co-organizer, Dr. Sue Natali, Senior Scientist at Woodwell Climate and lead of Permafrost Pathways. “This paper charts a path toward the integrated, global monitoring infrastructure we need to account for these emissions in climate policy before they outpace our ability to act.”
“Methane from natural systems is one of the biggest emerging climate risks,” said Dr. Danie Potocek, paper co-author and scientist at Spark Climate Solutions. “And right now, we simply don’t have the monitoring infrastructure to fully understand what we are up against. The global community has made real progress in building systems to track methane from human sources. Now we need to extend that to the rest of the methane challenge.”
Beneath the frozen surface: How AI is uncovering the secrets of permafrost
Beneath the surface of the Arctic, frozen ground holds clues about our planet’s past and its critical information about its future. Known as permafrost, this ground remains below 0°C for at least two years at a time and stores massive amounts of ice, organic carbon, and environmental history accumulated over thousands of years. But understanding how permafrost is changing throughout the Arctic landscape is no small task.
These regions span millions of square kilometers, and the datasets used to study them (from satellite imagery to high-resolution terrain maps) are often too large for most researchers to access or explore. Now, researchers working with the Permafrost Discovery Gateway, a platform hosted by the Arctic Data Center at the National Center for Ecological Analysis and Synthesis (NCEAS), are using artificial intelligence to change that. In collaboration with Google.org, the gateway combines satellite imagery, high-performance computing, and machine learning, opening a new window into Arctic change. One that anyone with an internet browser can explore!
Statement on public availability of scientific information and scientific evidence on climate change
The American Meteorological Society and the scientific societies listed below are surprised and concerned with the decision by the Federal Judiciary Center (FJC) to remove the climate science chapter from the Reference Manual on Scientific Evidence, Fourth Edition and the subsequent letter of February 19, 2026 from 21 attorneys general to the National Academies of Sciences, Engineering, and Medicine (NASEM).
Read more on the American Meteorological Society.
Twelve women carrying the flame for climate action despite the headwinds
It’s been a tough year for anyone working on the climate agenda. The Trump Administration’s repeal of the endangerment finding, the legal underpinning of U.S. climate regulation, was a coup de grace, after a litany of regulatory cuts and other moves to remove any impediment to unfettered fossil fuel development in the world’s largest economy.
Where the U.S. has led, much of the world has followed, with action on the nature and climate crises losing steam as corporate and government leaders have been forced to respond to a new U.S. administration determined to up-end the collaborative, rules-based international order.
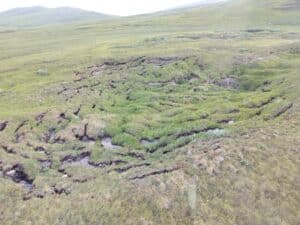
What changes for climate targets when permafrost emissions are included?
Permafrost and temperature targets
Permafrost, the permanently frozen ground found in large parts of the Arctic and boreal regions, holds enormous amounts of carbon, roughly twice as much as is currently in the atmosphere. As permafrost thaws, it releases carbon dioxide and methane to the atmosphere and adds significantly to further warming. Permafrost thaw is happening faster and faster and is no longer an issue of the distant future. The potential magnitude of permafrost carbon emissions means they directly affect estimates of remaining carbon budgets needed to keep Earth’s temperature increase below the 1.5° and 2° Celsius thresholds established by the Paris Agreement.
Thanks to the generosity of the Woodwell donor community, the first round of 2026 Fund for Climate Solutions (FCS) awardees has been announced. The FCS supports innovative, solutions-oriented climate science through a competitive, cross-disciplinary process. With more than $10 million raised to date, donor support has already fueled 84 research grants and leveraged millions of dollars in additional research grants since the program’s launch in 2018.
This most recent round of grants is supporting Woodwell experts working directly with communities to generate climate insights, bringing quality data on landscape carbon to international policy venues, and investigating links between climate change and winter weather.
Tracking water quality and empowering communities in the Amazon’s Arc of Deforestation
Lead: Allie Cunningham
The Kayapó people, Mẽbêngôkre (“People of the Water Hole”), are internationally recognized for their leadership in stewarding more than 9 million hectares of intact Amazon rainforest within a region known for rampant deforestation. This territorial defense is coordinated through the Kayapó Project (KP), an alliance of three Indigenous nongovernmental organizations which provides holistic governance and supports Kayapó communities with border patrols and community monitoring systems. Despite this extraordinary stewardship, a critical scientific gap persists, and KP has invited Science on the Fly and Woodwell Climate to help fill it. This FCS-supported project will establish a territory-wide, Indigenous-led scientific platform for water quality monitoring. Woodwell researchers and Kayapó community members will then use the baseline measurements taken to identify threats to the Xingu river ecosystem and Kayapó lands to understand other potential long-term, collaborative community science research.
Red Hook Climate Resilience Partnership: A collaborative initiative to strengthen community preparedness and adaptive capacity to climate risks
Lead: Dr. Nigel Golden
Climate change is making extreme weather events more intense across New York City, but some communities experience greater impacts than others. Red Hook, an area burdened by environmental, social, and economic inequities, was also one of the hardest-hit neighborhoods during Superstorm Sandy—floodwaters reached nearly every block. Despite state initiatives and city resilience plans, residents say their needs continue to be overlooked, and their voices go unheard. Through a partnership between Resilient Red Hook, Woodwell, and CUNY John Jay College of Criminal Justice, residents are leading the charge to change that. With community members as co-researchers, the team will assess climate risks at the neighborhood level and use the assessment to identify adaptation opportunities, with a focus on equity. With the partnerships, baseline data, and findings generated through this work, the team will be able to compete for larger, multi-year grants that can support real action on Red Hook’s terms. The project will also produce a research and engagement framework that other community-science partnerships can draw on.
From Arctic greenhouse gas budgets to policy: An opportunity to translate science to action
Lead: Dr. Bethany Sutherland
The United Nations Framework Convention on Climate Change (UNFCCC) has a well-recognized issue: its carbon accounting focuses on emissions and uptake due to human activity, without adequately considering natural lands. The Arctic region, which stores vast amounts of carbon, is a critical part of this accountability gap—many regions in the Arctic are already shifting to become net carbon emitters and emissions are projected to continue to rise. Previous Woodwell research has generated carbon budgets for the Arctic by evaluating modeled emissions against observations. With this FCS funding, the project team will amplify those findings and bring Arctic carbon budgets to international policy venues, including the Global Carbon Project and the UN’s Global Greenhouse Gas Watch. The grant will support travel to visit partner institutions and conferences, as well as a workshop hosted at Woodwell. In-person collaboration will strengthen the team’s connections with the global carbon accounting and reporting efforts that inform UN decision making.
Assessing the carbon cycle health and risk of global rangelands systems
Lead: Dr. Jennifer Watts
Rangelands’ soils and plants store large amounts of carbon, and millions of people directly depend on the goods and services these lands provide for well-being and survival. Rangeland ecosystems are also threatened by warming temperatures and land degradation, for example through overgrazing. However, the impacts of these changes on rangeland carbon is poorly understood, and science-informed data hasn’t been available to guide decision makers. The project team will model where rangelands are releasing or storing carbon, and where those lands are at heightened risk from future climate change impacts. This work will produce actionable insights for land management and policymaking at local, regional, and global scales. The team will also present their results at an official side event of the UN Convention to Combat Desertification, representing Woodwell at the conference for the first time.
Hot blobs, cold blobs, and crazy weather: How are greenhouse-gas-fueled SST anomalies affecting Northern Hemisphere weather patterns?
Lead: Dr. Jennifer Francis
Climate change is causing shifts in regional ocean temperatures—both heating and cooling—as the water absorbs extra heat trapped by greenhouse gases while accelerated melting of the Greenland Ice Sheet adds buoyant fresh water to the North Atlantic. When differences in temperature between ocean regions change, wind patterns shift, affecting the jet stream and weather. This project will use artificial intelligence to compare patterns in sea surface temperature and winter weather regimes over North America as well as the North Atlantic and Pacific Oceans. Recognizing and understanding how changing ocean temperatures are affecting weather patterns will improve seasonal weather forecasting and help decision-makers prepare for increasingly extreme weather conditions.
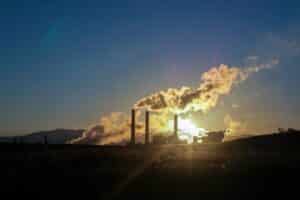
Flooding is a hallmark of the climate-changed world. Rising sea levels, extreme rainfall, and aging infrastructure systems have left communities across the U.S. facing increasing damages from flooding, making flood insurance an expensive necessity for more and more Americans.
But U.S. flood insurance policy was created on the assumption of a more stable and predictable climate and has struggled to keep up with the rapid pace of change. Two new papers led by Research Associate Dominick Dusseau shine a light on vulnerabilities within the American flood insurance system that will only be exacerbated as climate change advances.
You may be paying for your neighbor’s discount
The National Flood Insurance Program (NFIP), a program of the Federal Emergency Management Agency (FEMA), was created to help property owners secure affordable flood insurance and encourage communities to manage their flood risk.
One of the ways the NFIP encourages floodplain management is through the Community Rating System. The system rewards communities with discounts on their premiums for implementing certain actions. These actions range from building up the elevation of ground within a floodplain to making local flood maps publicly accessible. Actions are assigned points and the number of points determines how much of a discount the community will receive.
This reduction in price is not a true discount, however, because the NFIP adjusts state-wide premiums to make up the difference. The NFIP calculates the average percentage discount for the entire state and increases all premiums by that amount. This means policyholders in towns that are not even participating in the Community Rating System may be paying more than their risk level requires to subsidize their neighbor’s discounts.
“It’s basically a way for the NFIP to actuarially pay for the Community Rating System,” says Dusseau. “Because otherwise they’d be foregoing that revenue from the discounts. To recoup the lost income they do this cross-subsidization by putting it back into each policy by state. ”
Climate change will exacerbate inequalities
A study from Dusseau, published in the journal One Earth, shows that through the Community Rating System, roughly half of NFIP policyholders subsidize the discounts of the other half. In theory, subsidization ensures the NFIP is collecting enough revenue to pay out all their future obligations. But in reality, this framework presents two flaws. First, not all Community Rating System actions—publishing flood maps, for example— reduce damages. While the action may be beneficial to community awareness, it doesn’t translate directly to dollars saved.
Additionally, existing disparities between communities result in unequal distribution of the burden of subsidization.
“One of the big takeaways that we found was that it’s largely under-resourced rural counties that are subsidizing the more affluent, well-resourced urban counties,” says Dusseau.
Even though many rural communities would be eligible for discounts themselves, they may not have the capacity available to take advantage of them.
“There’s a bureaucracy involved here. There’s paperwork. You have to document all of these things that you’re doing. You have to submit the application. You need someone that’s a certified floodplain manager,” says Dusseau. “Not every town has that capacity, so it just falls through the cracks.”
This means that already resource-strapped communities may be paying more than required for their true risk level.
Dusseau’s study points out that these inequalities will be exacerbated by climate change. The NFIP has long underpriced policies. The rising sea levels and more extreme precipitation caused by climate change has only widened the gap between the program’s revenue and obligated pay-outs. In 2021, FEMA implemented a new framework, called Risk Rating 2.0, that takes the impacts of climate change to date into account, gradually raising premiums year over year to more closely align with the actual risk of damages.
“And what we see is that states with the greatest level of inequality now will experience even worse disparities in the future,” says Dusseau.
How accurate are flood models?
In addition to inequity, flood insurance suffers from a frustrating lack of transparency, with each company and the NFIP employing a proprietary combination of models to decide premium prices. A second paper led by Dusseau, published in the Journal of Catastrophe Risk and Resilience in February, generates some much needed transparency around the data underlying the insurance industries assumptions.
One type of model employed by insurers is called a catastrophe model. These models can estimate the likely damages from both natural and man-made hazard events like wildfires, terror attacks, and hurricanes. Dusseau’s study evaluated the accuracy of seven flood-specific catastrophe models, including three commonly used by the NFIP.
“Insurers rely heavily on these models that have historically been very ‘black-box’—nearly impossible to evaluate their methods,” says Assistant Scientist Zachary Zobel, a co-author on the paper. “Without proper independent review of these models, insurers will continue to misrepresent the risk catastrophes pose on local communities.”
The study found that model accuracy varied widely. Some models overestimated flood losses, while others underestimated losses—by up to 13 times in the most extreme case. This has major implications for the ultimate cost of flood insurance.
“There is a non-trivial difference in the premiums that would be passed on to consumers based on these assumptions,” says Dusseau.
Catastrophe models are also still based upon historical data. Many have not been updated to account for the impacts of climate change, let alone cast forward to how flood risk may change in the future.
“The insurance industry drives using only the rearview mirror. Yesterday’s data to price tomorrow’s risks doesn’t work in a world of more extremes, says Vice President of Science Dr. Christopher Schwalm, who also contributed to the paper. “The past is no longer a reliable guide for the future. To stay ahead, we have to stop guessing based on what happened years ago and start modeling the ‘new extremes’ we are seeing right now.”
Informing policies that protect people
Dusseau along with Woodwell’s risk and policy experts have made science-backed contributions to conversations about improving flood insurance. Dusseau and Senior Policy Analyst Jamie Cummings authored a policy brief last April that advocates for NFIP reforms that help property owners access affordable flood protection, including the creation of a standard national catastrophe model. Dusseau has also briefed congressional staff, highlighting areas where Congress could play a role in bolstering the long-term resilience and insurability of communities.
However, aligning pricing more closely with the realities of climate change is much more complicated—and for many property owners, emotional—than simply incorporating the right data. The increases brought on by Risk Rating 2.0 have already pushed flood insurance out of the range of affordability for many policyholders, forcing them to drop their coverage. The pricing framework is a sticking point in lawmakers’ debates over reauthorizing the NFIP in the long term. The program is currently funded through September 30, 2026.
“How do you balance updating policies to reflect true climate risk with affordability, in a political context? Yes, you want people to know that they’re in a flood zone, but if you price them out of the market, are you really helping them?” says Woodwell Climate Vice President of Policy and Government Relations Laura Uttley. “That’s why the work Woodwell’s risk team does is so vital. The science and modeling they provide adds context for the development and implementation of new policies. We are very pragmatic about the ways we recommend change.”
Additionally, federal policy changes happen much slower than climate ones, making it a challenge to build policy that is both durable and versatile.
“Policy change at the federal level can be incredibly slow. We need to consider policy proposals that build durable systems that enable adaptability, recognizing the urgency posed by rapidly changing conditions,” says Uttley.
Woodwell Climate has been involved in advocacy around the inclusion of flooding from extreme rainfall— called pluvial flooding—in FEMA’s regulatory maps. These maps identify “flood hazard zones” in which property owners are required to have flood insurance. Currently they only represent coastal and riverine flooding hazards. This has led many property owners to mistakenly believe their homes are not at risk.
Though improved data and transparency might ultimately translate to higher costs for some, Dusseau says the alternative, not knowing, hurts people in the long run.
“If people don’t know that they’re at high risk, they won’t know what to do about it so they won’t do anything about it,” says Dusseau.