Woodwell Climate Research Center and UN Climate Change are collaborating to develop a new training course—announced November 14 at COP29 in Azerbaijan—to prepare experts for a voluntary review of adaptation reporting by Parties under the Paris Agreement.
Countries submit Biennial Transparency Reports (BTRs) every two years to inform the world about their national climate efforts. These reports are vital enabling tools for governments, helping to build a robust evidence base critical to strengthening climate policies and climate action over time. The first BTRs are due at the end of 2024.
“Transparency is a priority for the COP29 presidency, because transparency is a cornerstone of climate action,” said a representative for the COP29 presidency at the Together for Transparency event on Thursday.
Each BTR will be reviewed by teams of technical experts coordinated by UN Climate Change, which provides a set of training courses for experts to prepare for that task. A country can request a voluntary review of the information it has reported on adaptation efforts, which requires special expertise on climate risk and adaptation to execute.
This collaboration draws on Woodwell expertise on climate change impacts and adaptation reporting, as well as climate risk and vulnerability assessments. Woodwell Climate’s Director of International Government Relations, Dr. Matti Goldberg, was responsible for spearheading this collaborative effort.
The training will encompass a set of five lessons and accompanying exams that help future expert reviewers learn key aspects of vulnerability assessments, adaptation planning, monitoring and evaluation, and loss and damage, among other issues. These lessons will be launched in a PDF downloadable format by the end of 2024.
Squabbling, compromise, disappointment, hope, and incremental change— these are features of any decision making process, but especially one requiring the cooperation and agreement of nearly 200 countries with varied interests, resources, and desire for change.
At the annual Conference of Parties (COP) to the United Nations Framework Convention on Climate Change (UNFCCC), member countries gather to hash out the gritty details of international agreements concerning climate change. These COPs have become the world’s most prominent stage for climate action, drawing not only heads of state and diplomats, but also scientists, activists, businesses, journalists, financial organizations, Indigenous knowledge holders, artists, and spiritual leaders, just to name a few. All are in attendance to influence the future of planet Earth.
Here’s how climate’s biggest event of the year steers the international framework for combating climate change.
What is COP?
Formally, the COP is the decision-making platform for signatories of the UN Framework Convention on Climate Change (UNFCCC). The UNFCCC is a legally binding agreement between UN member countries, created specifically to tackle the crisis of climate change. Each year since its creation, delegations from participating countries (called Parties) have met at the COP to discuss the agreements and mechanisms by which to address climate change.
After two weeks of negotiation, conference delegates produce text that becomes binding for UNFCCC Parties. These texts have legislated things from the commitment of industrialized nations to reduce emissions, to the direction of funding for climate action, to the upper limit of acceptable warming.
The prominence and importance of these conference proceedings have grown with each year and each increment of warming. The conference itself has expanded to encompass climate action across multiple channels at once.
“There are actually three COPs happening in parallel,” says Woodwell Climate’s Director of International Government Relations, Dr. Matti Goldberg, who has learned the ins and outs of the conference over 15 years spent working for the UN’s Climate Change Secretariat.
The first layer is the core of the conference— the negotiations. This is the space where each participating country sends delegates to argue on their behalf. The agenda for each year’s negotiations is developed during preparatory meetings of the delegates, with planning sometimes starting two years in advance, and resulting in agendas of 50-60 interlinked issues. COPs are typically judged as successes or failures based on the strength of the resulting text from the formal negotiations. The complexity of the issues, and the negotiating tactics of different countries, tend to push final agreements well beyond the scheduled closing of the COP.
Then there’s what Goldberg calls the “high-level COP.” This is the platform for heads of state to showcase their country’s progress on various issues. Think, speeches from the president, announcements of new coalitions, hand-shaking between ministers, or denunciations of other countries’ lack of action. Although the high-level COP can feel like superficial performance, deals between countries can help move the negotiations forward— or delay them, depending on a country’s interests.
Surrounding both the formal negotiations and closed door deals is the “third COP” — also referred to as the “Blue Zone”: a space open to scientists, NGOs, activists, and companies for hosting side events, pavilions with panel talks and presentations, forge new partnerships, hold protests, and apply pressure on negotiators. The third COP also spills out into a “Green Zone”, a space where those not badged for the official conference can organize events and contribute to the momentum of the moment.
What does an NGO do at COP?
For an organization like Woodwell Climate, the third COP is the main stage on which to contribute to the conference.
“Our first priority is to showcase our research and its relevance to the key questions of each year’s COP,” says Goldberg.
At COP29 in Baku, Azerbaijan, Woodwell Climate will host a pavilion to showcase the organization’s work in several key areas, including climate risks and national security, accounting for growing natural emissions sources like permafrost thaw and wildfires, as well as emerging collaborations with new partner countries such as Ethiopia. The pavilion also serves as a convening place to discuss work with partners.
“The sheer scale of participation at COPs makes them critical annual opportunities to solidify existing partnerships and build new ones,” says Goldberg.
While participants of this third COP aren’t officially part of negotiations, Woodwell Climate scientists still have opportunities to participate in the more formal COP processes. Each COP hosts an “Earth Information Day” where scientists exchange data and research with country delegations to better inform decision making. At COP29, Woodwell has proposed to highlight the latest research on wildfire emissions.
Scientists also have a role to play in ensuring national emissions reductions plans are based on accurate numbers—a point that Woodwell Climate will be emphasizing both at this COP and beyond. In 2025, countries must submit their updated 5-year climate targets (called Nationally Determined Contributions or NDCs) to the UNFCCC. The adequacy of those targets depends on how much carbon can still be emitted without surpassing the agreed-upon maximum limit of warming.
“Our research on permafrost and wildfires indicates that the global carbon budget available for staying below the 1.5 degrees Celcius temperature limit might be much smaller than countries are thinking right now,” says Goldberg. “From the Woodwell perspective, it would be great to remind the international community that the numbers need to add up. We need to take into account these emissions that are not being discussed.”
Successes and failures in three decades of COP
Over his tenure with the UN Secretariat, Goldberg has witnessed both promising action and frustrating setbacks, sometimes at the same conference.
COP15, held in Copenhagen in 2009 was one of those moments for him. Here negotiations decayed, and the weak resulting agreement failed to legally bind countries to emissions reductions.
“Turkeys don’t vote for Thanksgiving,” Goldberg jokes. “Countries will generally not agree to a regime that will force them to take on targets determined at the UN or by others.”
But Goldberg says that Copenhagen did, at least, define a new paradigm where every country would commit to doing something. Voluntarily, and perhaps not ambitiously enough, but in a year widely considered a failure, steps towards universal climate cooperation were still made.
Each successive COP built upon this new paradigm and in 2015 the conference arrived at another milestone— the Paris Agreement. This is the framework under which the world operates today, with every country creating NDCs appropriate to their size and resources, with the goal of limiting warming to 1.5 degrees C above pre-industrial levels.
The agreement spurred more conversation around how that goal would be achieved, and in 2018 the parties adopted a rulebook for its implementation. Since then, however, Goldberg says many of the conferences have been “searching for real purpose” — some kind of action to match the ambition of the Paris Agreement. But, in Goldberg’s mind, that doesn’t necessarily indicate a failure of the process.
“You can’t have a spectacle forever,” says Goldberg. “At some point the pressure should be less on the COP itself and more on countries actually working under the Paris Agreement to get more ambitious about what they’re doing, and probably making some very painful decisions at the national level.”
Climate has the world’s attention
But of course, policy making moves slowly, both for the UN and national governments. And with each year that passes, cooperation and increased ambition becomes more urgent. In 2023, record high temperatures spurred conversations about whether the 1.5 degree limit has already been surpassed. In five years, Goldberg states, “it might be way too late even to pretend that we are under that limit.”
But Goldberg remains hopeful. Before the COPs, before 30 years of tough conversations attempting to find a way through the climate crisis, Goldberg says, the prevailing thought among political scientists was that international cooperation on this scale was a fantasy. But despite its failures, the process has persisted, inching the world towards climate action. Other international treaties have taken their lead from this process as well, hosting COPs to address issues like plastic pollution and biodiversity.
“The fact that there are so many people dedicated to solving this and to working through mutual disagreements, that people haven’t walked away, makes me hopeful,” says Goldberg. “This is possibly the hardest global policy problem there is, and it has the world’s attention. I think that’s very positive.”
Where has all the rain gone? Bone-dry October strikes much of US
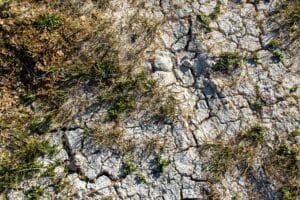
A bone-dry October is pushing nearly half of the United States into a flash drought, leading to fires in the Midwest and hindering shipping on the Mississippi River.
More than 100 different long-term weather stations in 26 states, including Alaska, are having their driest October on record, through Sunday, according to records by the Southern Regional Climate Center and Midwest Regional Climate Center. Cities that have had no measurable rain for October include New York, Houston, Dallas, Philadelphia, San Francisco and Sioux City, Iowa, along with normal dry spots such as Los Angeles, Las Vegas and Phoenix, National Weather Service records show.
The Y-K Delta’s permafrost could be entirely gone within decades
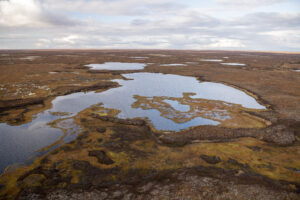
All over Alaska, perennially frozen ground, or permafrost, is melting. During a panel discussion at the Arctic Encounter Symposium in April, an ecologist said the Yukon-Kuskokwim Delta is set to lose nearly all of its permafrost in the next two decades. And a warming climate is to blame.
“It’s bad news,” said Sue Natali, a Senior Scientist and leader of the Permafrost Pathways Initiative at the Woodwell Climate Research Center. The goal of the initiative is to help develop strategies to manage and adapt to the enormous impact permafrost thaw is having on Y-K Delta communities. “It’s worse if you don’t know, it’s worse if you don’t plan and it’s worse if you’re not part of the planning process,” she said.
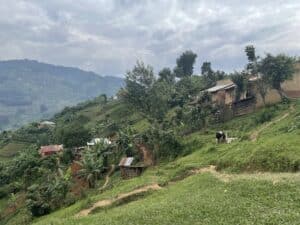
The economic impact of shifting to climate- smart agricultural and conservation practices in the Bwindi Ecosystem: A Targeted Scenario Analysis.
Executive summary
Since the 1950s, southwestern Uganda has faced significant environmental challenges due to population growth, particularly in Kabale, Kisoro, and Rukungiri districts. Over 75% of Kisoro’s population relies on natural resources, leading to issues like wetland and soil degradation, deforestation, overgrazing, water pollution, and poor sanitation. These problems contribute to low productivity, income, and living standards. Climate change exacerbates these challenges, increasing dependency on national parks and environmental resources.
To address these issues, nature-based tourism and climate-smart agriculture (CSA) aim to diversify livelihoods and reduce food insecurity, thereby decreasing the environmental impact. Through sustainable farming techniques, CSA practices enhance productivity, resilience, and emission reduction. Sustainable Ecosystem Management (SEM) alternatives, including CSA, significantly improve productivity and potential revenues compared to Business-As-Usual (BAU) strategies under a changed future climate scenario. SEM can lead to an average revenue increase of 117%, particularly benefiting key agricultural crops for food security and income generation. However, technical and institutional barriers like limited knowledge, asset access, and insecure land rights hinder the design of effective policy and action, limit access to potential sources of capital, and weaken the potential of CSA to deliver resilient economic growth and poverty alleviation.
Effective policy implementation requires improved agricultural extension services, better management of revenue-sharing schemes, and enhanced inter-sector coordination. Public investment in agricultural extension, climate finance mechanisms, and participatory policy approaches are essential. Strengthening policy also includes improving tourism-related revenue- sharing transparency and accountability, which can accelerate sustainable development and conservation efforts in the region.